
The Most Recent Quarter's DFW Retail Market Update
DFW 3rd quarter 2010 retail activity experienced improved market conditions in terms of property occupancy and gross retail square footage space absorption. The vacancy rates declined by .02% down to 9.1%. There was a positive absorption growth of 719,121 square feet in the DFW retail marketplace and a 55,800 square foot decrease in sub-lease space. However, rental rates demonstrated a slight retrenchment down to $13.75 per square foot down $.03 from the previous quarter.
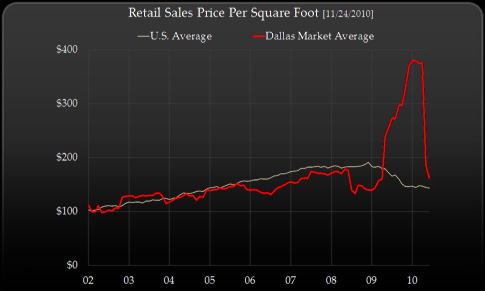
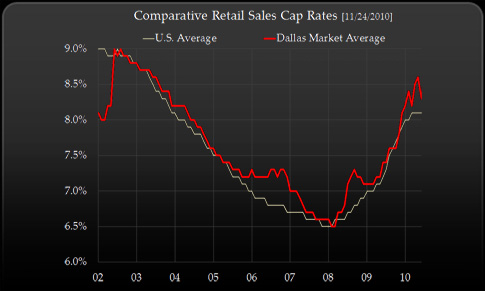
The Dallas-Fort Worth retail sales activites showed increasing sales cap rates climbing to 9.68% when compared to same 2009 period which reflected a 8.05% average sales cap rate. The average price per square foot sale on the 8 DFW Retail buildings aggregating to 352,915 square foot of retail on facilities having a size in excess of 15,000 square feet. These sales averaged $125.61 per square foot compared to the prior quarter when six buildings were sold representing 280,207 square feet at $97.80 per square foot.
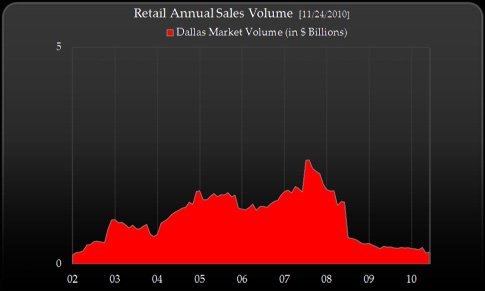
Cummulative Sales volumes for the most recent quarter amounted to $44,331,000 on the eight buildings sold. This compares to the prior quarter sales of $27,405,000 in the first quarter of 2010. Total retail sales activity through this quarter represented $71,736,000 on a total of eight property sales first the first half of 2010 at an average price of $113.31. This compares to 2009 first quarter sales which agggregated to 17 transactions involving $75,415,000 at an average sales price of $74.08.
Retail construction completiion during the 3rd quarter of 2010 amounted to 150,034 square feet of space. At present there are 1,198,135 square feet of space under construction. As an overview, retail construction has slowed, as both tenants and owners attempt to attract and shore-up income –leaving expansion on hold. Tenant retention and creative lease options and structuring will separate seasoned property ownership and professionals from the novices and this will be the key for preserving property market value.
![]()
DFW Retail Market Statistical Overview [Q-3-2010]
Project Types Properties Square Footage Vacancy Rate/SF
General Retail 14,037 142,704,112 5.5% $12.89
Malls 43 33,401.577 7.1% $22.48
Power Centers 71 26,165,756 7.7% $19.57
Shopping Centers 3,443 151,307.708 13.3% $13.22
Specialty Centers 16 1,742,427 5.6% $31.61
Total Retail 20,425 355,351,580 9.1% $13.75
Item Description Amount Prior Qtr Change
DFW Retail Vacancy Rate 9.1% vs. 9.2% [-1.1%]
Dallas Retail Rental Rates $13.75 vs. $13.79 [-0.3%]
Dallas Retail Absorption Rate 719,121 vs. 268,401 [167.9%]
Dallas Sub-Lease Space Available 1,331,194 vs. 1,387,741 [-4.08%]
DFW Construction Deliveries [sf] 150,034 vs. 569,377 [-280%]
Last Qtr. Sales Price/SF & Volume $44,331,000 vs. $27,405,000 [61.8%]
Number of Sales Tansactions 8 vs. 6 [25.5%]
Square Footage 325,915 vs. 280,207 [14.0%]
Price Per Square Foot $125,61 vs. $97.80 [22.1%]
Current Cap Rate | Prior Cap Rate 9.68% vs. 8.15% [18.8%]
![]()
DFW Job Growth for 2010: 31,300
Job Growth Increase Year over Year +1.1%
DFW Job Growth for 2009: (107,300)DFW Non-Farm SMSA Employment 2010: 2,869,500
DFW Unemployment Rate [Sept. 2010] 7.9%
DFW Unemployment Rate [June 2010] 8.6%
![]()