
The Dallas Industrial Office Flex Market Update
A synopsis of the Office Flex Sales and Lease Activities in the Dallas Fort Worth market place as of the 3rd quarter of 2010 are set forth below:
![]()
Item Description Qtr 3-2010 Qtr 2-2010 Q-1 2010% % Change
Number of Flex Buildings 6,893 6,876 6,806 24.72%
Total Square Footage 142,043,718 142,550,417 141,967,619 (.356%)
Vacancy Rate 12.0% 11.6% 11.8% 3.44%
Dallas Flex Rental Rates $7.29 $7.35 $7.42 (.82%)
Dallas Absorption Rate (836,838) (445,363) (567,789) (87.9%)
Construction Deliveries 106,148 106,148 106,148 (0.00%)
Under Construction 29,738 0 7,402 301.8%
Running 12 Month Dallas Sales Data:
Sales Volume $91,900,000 $196,300,000 - ( 53.6%)
Total SF Sold + In Contract 1,252,146 4,262,314 - (70.6%)
Number of Properties Sold 10 11 - (9.09%)
Newly Offered Properties $565,000,000 $132,400,000 - (326.7%)
Offered Properties Price/SF $79.20 $63.90 - 24.9%
5 Yr. Office Employment Growth: -.90%
Inventory Growth: 6.20%
Difference: - 7.10%
![]()
The Office Flex Update:
The Dallas–Fort Worth office market market ended with the 3rd quarter 2010 vacancy rate of 12% increasing from the prior quarter vacancy of 11.6% reflecting a 3.44% increase. There was a negative absorption of 836,838 square feet as compared to a prior quarter absorption of (445,363) which amd this relfected a 87.9% decrease in office flex absorption. Rental Rates decreased by a small margin from $7.35 per square foot to $7.29 per square foot and this represented a diminutive .82% decrease for the quarter.
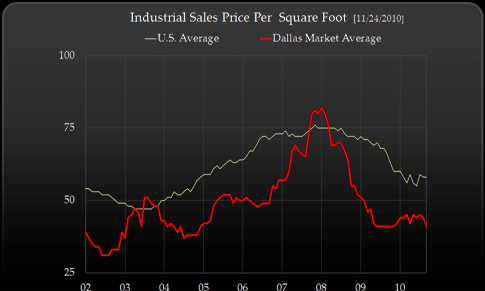
A graphic chart of historical cap rates of transactions over $5,000,000 on DFW Commercial Office Flex Space and comparing it to the national average cap rates as computed by Real Capital Analytics is depicted below:
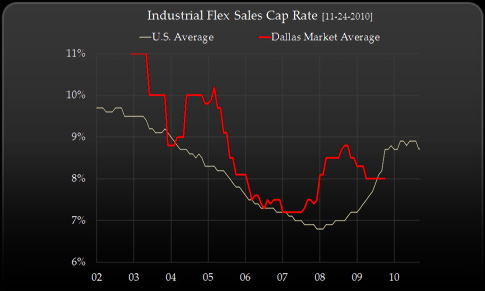
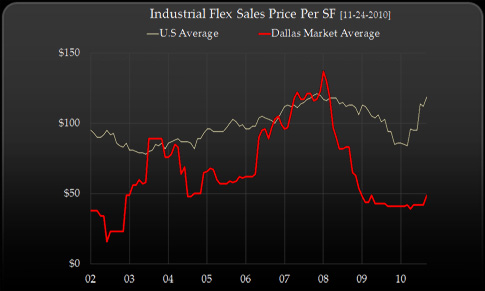
The minimal amount of new product currently in the pipeline will alleviate vacancy pressure. We anticipate a continued “flight-to-quality” as stable tenants upgrade their space. As rental rates begin to stabilize and lose their preciptious downward trends, tenants are seeking to secure longer terms lease at these lower rental rates prior to an anticipated rental rate escallation in 2012. Property owners are still searching for tenants that can maintain cash flow integrity with a solid ability to weather the recession. A view of the average price per square foot of office flex space in Dallas shows the competitve landscape of DFW Marketplace and shows why DFW imposes a very viable option for companies seeking office-flex space as potential tenants and owners when compared to the options on a National Basis. This graph likewise suggests a large upward capital appreciation for ownership as the market swings back into balance through 2011 and 2012.
This market should open new opportunities and trigger increased occupancy in the office-flex sectors for tenants looking to find price significant savings that would not be typically available in the full-service office sector. Sales Volume indicates a 54%decrease in the 12 month running sales volume in terms of Dollar Volume and a 9.09% decrease in terms of number of transactions sold or put under contract in the last quarter statistical data. New Properties being offered in the market for Dallas Office Flex properties has increased 327% while the actual sales prices on these flex property has increased 25% over in the past quarter signaling a positive pricing point change in the Dallas Marketplace.
![]()
DFW Airport and Intermodal Capabilities Spawn Growth:
We fully expect industrial and office-flex tenants to remain in a lateral position for 2010. Dallas-Fort Worth continues to attract corporations who restructure and transfer major distribution facilities to the area. The intermodal development in South Dallas along I-45 and I-20 with intermodal facilities of both Union Pacific and the Burlington-Northern Santa Fe is having a significant impact on the DFW industrial marketplace.
The DFW Airport and surrounding sub-markets continue to be attractive airport distribution channels for both tenancy and ownership. Other compelling demand drivers for these sub-markets include the establishment of Free Trade Zones, which significantly minimize tax obligations of the multi-national corporations operating internationally. Because of Dallas-Fort Worth’s potential job growth and minimal population decreases, the industrial market should be positioned to rebound quickly, as profitable real estate movements begin to pick up velocity.
IndustrialQuarterly Stats suggest market stabilization in the Industrial Marketplace:
The Industrial Market of Dallas-Fort Worth industrial 3rd quarter 2010 vacancy rate remained constant from the 2nd quarter 2010 vacancy rate of 12.0% suggesting a market stabilization in the DFW marketplace. However, net absorption decreased by 86.1% to 113,325 down from the prior quarter of 809,761. Construction deliveires increased 11% to 1,060,759 but under construction properties decreased by 759% to 598,947 from the prior quarter of 69,669 square feet. Rental Rates decreased by 1% from $3.82 downto $3.78 in quarter.

Item Description Qtr 3-2010 Qtr 2-2010 Qtr 1-2010% % Change
No. of Industrial Buildings 11,524 11,409 11,283 1.008%
Total Square Footage 611,320,394 609,555,571 604,640,878 .2895%
Vacancy Rate 12.0% 12.0% 12.1% 0.00%
Dallas Industrial Rates $3.78 $3.82 $3.84 (1.05%)
Dallas Absorption Rate 113,325 809,761 (279,167) (86.1%)
Construction Deliveries 1,060,759 952,815 942,732 11.33%
Under Construction 598,948 69,669 205,283 (759.7%)
Costar 2010 vs. 2009 Year 1st 2 Qtrs. of Dallas Sales Data on Properties Under $5M:
Sales Volume - $56,371,350 $40,104,179 40.56%
Dallas Cap Rates - 11.53% 10.46% 10.22%
Real Capital Analytics Running 12 Month Dallas Sales Data on Properties > $5,000,000:
Total SF Sold + In Contract - $1,039,200,0000 - -
Number of Properties Sold - 50 - -
Total Square Feet - 24,843,405 - -
Sold Properties Price/SF - $41.50 - -
Newly Offered Properties - - $955,600,000 (8.74%)
Number of Properties Sold - - 57 12.28%
Total Square Feet - - 16,142,563 (35.03%)
Offered Properties Price/SF - - $55.10 (32.77%)
Weighted Cap on Offered - - 8.58% -
Mean Cap Rate on Offered - - 8.57% -
![]()
5 Yr. Office Employment Growth: -.90%
Inventory Growth: 6.20%
Difference: - 7.10%
![]()
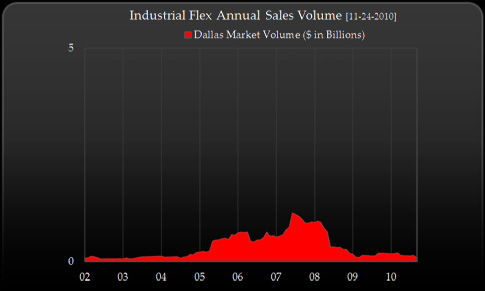
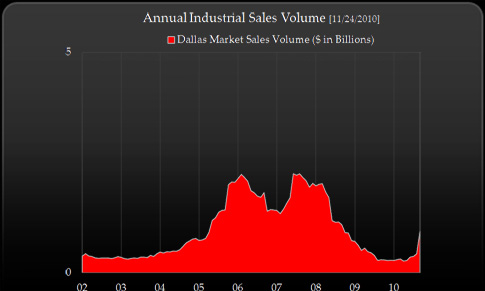
Dallas Quarterly Industrial Sales Activities and Graphics:
Cap Rates through tne 2nd quarter of 2010 per Costar relect a sales volume increase of 67% in terms of number of transactions. Sales Volume increased 40.6%. Cap Rates increased 10.22% to 11.53% in the 2nd quarter of 2010. Deal transaction size has considerable impact on cap rates. On transactions in excess of $5,000,000 sales reflected cap rates in the DFW Market which are considerably below those of deals of lesser size as depicted below:
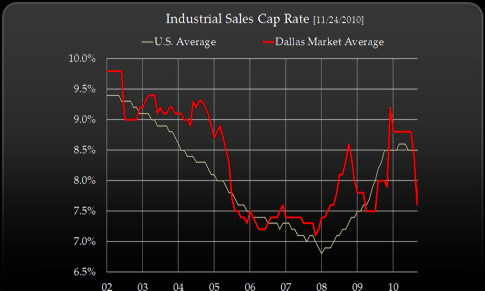
Cap Rates suggest a cap rate compression cycle in 2010 on these larger transactions which have compressed from approximately 9.25% in the 4th quarter of 2009 to the current 7.6% cap rate range through Q-2 of 2010.
In terms of price per square foot the above graphic depicts the competitive marketplace of DFW where space can be acquired at a price considerably below the national price of industrial space on a national basis. Other compelling demand drivers for these sub-markets include the establishment of Free Trade Zones, which significantly minimize tax obligations of the multi-national corporations operating internationally.
![]()
Cap Rate Explosion = Value Erosion
Understanding the variance in cap rates can be seen in view of historical divergence over a historical period of time as shown below. In these graphics one can perceive the significant cap rate expansion which debilitated the economic foundations of the real estate industry during the collapse or real estate values in August of 2007. Cap Rates in 2008 were not reflective of the current marketplace. Why did this occur?
Wall Street’s CMBS pipeline filtered massive long-term debt into the commercial real estate market resulting in significant cap rate compression and asset value appreciation. In today’s current market place long term debt is very scarce, and CBMS financing nearly non-existent. Needs for increasing equity and capital liquidity are growing, triggering a cap rate explosion.
Substantive property value erosion occured . Decisive action became increasingly important. Owners have had to contemplate the merit of jumping out ahead of a “falling knife” and transacting a property sale or evaluate the “risk-reward” dynamics of holding onto the asset through the next investment cycle. The following graphic depicts this cap rate explosion phenomenon:
Historic Distribution of Cap Rates From 2002 Through 2008
Cap Rate/Year 2008 2007 2006 2005 2004 2003 2002
5% or Less 13.4% 18.28% 15.04% 14.94% 6.03% 1.99% 0.87%
6% or 7% 57.99% 63.39% 61.42% 52.91% 43.18% 27.87% 11.49%
8% or 9% 24.86% 16.47% 20.92% 27.69% 40.94% 52.88% 53.28%
10% or more 3.75% 1.86% 2.62% 4.46% 9.85% 17.27% 34.35%
Data Source: Real Capital Analytics
![]()
The New Rules of Money - Rebalancing the Equity Equation
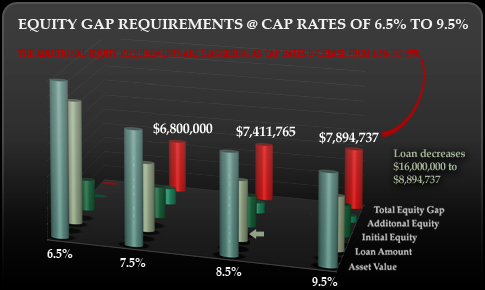
Investors have been forced to reevaluate the asset holding cost of their portfolio assets. With cap rates exploding and property values eroding, the adjusted requisite equity contribution to secure new financing is staggering. The above example contemplates an original $20,000,000 asset and a $4,000,000 equity position.
As the loan underwriters require a 65% loan to value structure, the additional equity requirement is pictured as the cap rates increase at 100 Basis Point Increases from 6.5%-9.5%. The Original Equity of $4,000,000 requires an additional capital requirement of $7,894,737 if cap rates increase to 9.5%.
More importantly the asset value decreases from its orignal $20,000,000 to $11,578,947. All investors who have refinancing requirements in the next five to seven years must evaluate whether or not such additional capital injections are appropriate as they try to optimize their portfolio holdings.
![]()