
Office Market Update
![]()
![]()
The Office Market Statistical Data:
A synopsis of the Office Sales and Lease and Price Inventory in DFW in the 3rd quarter of 2010 is set forth below:
Class Buildings Inventory SF Absorption Rate/SF Vacancy
Class A Office 416 118,696,600 (63,999) $22.28 19.6%
Class B Office 4,333 163,311,151 607,068 $17.71 18.5%
Class C Office 4,502 45,940,682 93,881 $19.38 11.6%
Total Office 9,251 327,948,433 636,950 $19.38 17.9%

Item Description Qtr 3-2010 Qtr 2-2010 Q-1 2010% % Change
Vacancy Rate 17.9% 18.4% 18.3% 2.71%
Dallas Rental Rates $19.38 $19.54 $19.94 (.81%)
Dallas Absorption Rate 1,697,244 (269,869) (790,425) 728.9%
Sub Lease Space Available 2,409,014 2,643,543 2,586,982 (8.87%)
Construction Deliveries 63,005 593,808 1,120,113 (89.4%)
Buildings Delivered 4 24 12 (83.3%)
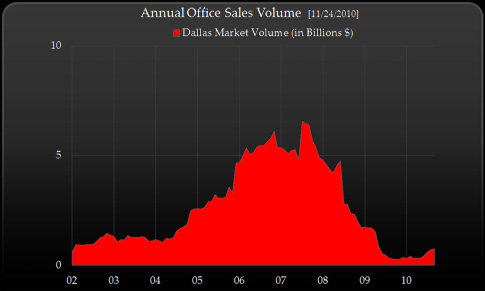
Dallas Sales Volume - $107,022,869 $99,552,500 7.5%
Dallas Sales Sq. Ft. - 1,791,968 630,700 184.1%
Number of Transactions - 13 3 333.3%
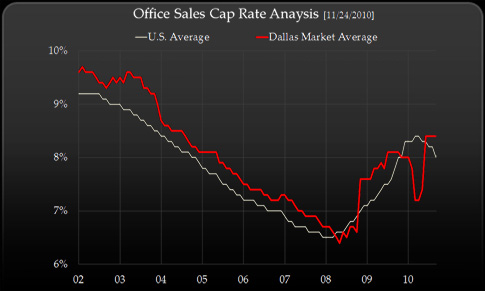
Cap Rates - 8.44% 7.40% 14.1%
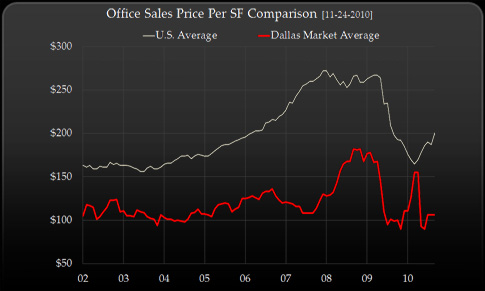
Price Per Sq. Ft. - $59.72 $157.84 ( 62.16%)
5 Yr. Office Employment Growth: -.90%
Inventory Growth: 6.20%
Difference: - 7.10%
![]()
The Office Update:
The Dallas–Fort Worth office market ended with the 3rd quarter 2010 vacancy rate of 17.9% decreasing from 18.4% in the prior quarter reflecting a 2.71% decrease in the overall DFW vacancy factor. The local market had a positive absorption of 1,697,244 compared to the prior quarter negative absorption amount of (269,869) in the 2nd quarter of 2010.
A graphic chart of historical cap rates of transactions over $5,000,000 as computed by Real Capital Analytics is depicted below:
The minimal amount of new product currently in the pipeline will alleviate vacancy pressure. Sublease inventory increased from 2,409,014 square feet from 2,643,54. square feet in the second quarter of 2010. We anticipate a continued “flight-to-quality” as stable tenants upgrade their space accommodations into higher quality assets moving from the Class C to B sector. As rental rates begin to stabilize and lose their preciptious downward trends, tenants are seeking to secure longer terms lease at these lower rental rates prior to anticipated rental rate escallation in 2012. Property owners are still searching for tenants that can maintain cash flow integrity with a solid ability to weather the recession.
This market should open new opportunities and trigger increased occupancy in the office-flex sectors for tenants looking to find price significant savings that would not be typically available in the full-service office sector. We also anticipate increased demand for higher density office utilization, which will allow offices with higher parking capacities to take a disproportionate market share of potential lease prospects, while companies work on managing their bottom lines.
We are starting to see increased corporate earnings which will ultimately drive offfice occupancies upward with meaningful expansions. Larger 10-year term deals will become rare as corporate America becomes less willing to make long-term financial commitments. Many tenants are questioning the timing of the real market bottom creation at which time they will start to extend their lease terms. However, Dallas-Fort Worth continues to attract corporations who restructure and transfer headquarters to the vibrant and price competitive marketplace as evidenced in the recent relocation of Comerica and AT&T to the Dallas Metroplex.
The Dallas-Fort Worth office sector is not experiencing the massive occupancy degradation that the recession is imposing upon most of the country. Dallas poses a solid marketplace for property owners wishing to leave markets who have been hit been hit hard by the recession.
The lack of credit has dramatically impeded business operations. Banks will continue to hold their capital until a level of foundational assurance is realized. Many institutional investors are seeking high-level bond yields which approximate 15% per annum returns. This makes the feasibility of investment in commercial real estate less compelling as investors seek to procure reasonable debt capital for their real property investments.
While banks in the Dallas-Fort Worth market are approving deals, the requisite equity component has become a major hurdle for traditional developers. The traditional 75%-25% debt to equity ratio has severely deteriorated and is more reflective of a 50%-60% structure. Increased capital raising by REITS has allowed this market purchaer to become more active in the maketplace.
Transactions that are being completed are often comprised of assumable debt, seller financing, or stable long-term leases which provide the economic stability to mitigate risk for the institutional investor. Larger deal such as portfolio transactions are much harder to transact than in the prior year, and this trend is anticipated to continue as mortgagees prefer to spread their risk than have a consolidation to a specific borrower or asset.
Local banks are decisively holding onto “lines of credit” and the unforeseen challenge will be to convince businesses to be aggressive to take advantage of market conditions. Real estate is no longer the preferred “asset of choice,” as cash has loudly declared why it is still “king.” The ability to accumulate capital will give cash-strapped investors the ability to weather the current market volatilities and sail to new levels of perceptible opportunities in late 2010 or 2011.
Both corporate and consumer confidence and corporate profits are going to be the rudder which will ultimately determine the long-awaited return to consumption. The economic policy of the Obama Administration has been substantially impeding business growth and has put a lot of uncertaininty into today's executive decison makers and Wall-Street Investors. This governmental power assetion and substnative nationalization of various industries including banking, auto-manufacturing, insurance, and health care is become very problematic for the traditional business owner. The minimal impact of governmental stimulus and TARP funds is being questioned in the marketplace. Determining what will spawn meaningful economic growth in the United States will have an impact on all markets including Dallas-Fort Worth. The current trends would indicate that until the influx of bad loans finally leaves the market place, banks (the ones remaining) will keep a tight purse on their capital base.
However, banks are trying to work through troubled real estate by resolving the asset disposition by selling notes rather than pulling the foreclosure ripcord. Their continued adoption of the "pretend and extend" management policy of trying to work with borrower's who can continue to debt service their properties is delaying resolution of many of today's troubled assets within the real estate community. They are trying to protect their own capital base undesirous of having to recapitalize their own capital base which would be required if they were to bring in troubled assets back into the bank as a non-performing loans through the foreclosure process.
Numerous Investors have been looking for the “blood in the water” deal opportunities. However, many of them have been frustrated to date as there has not yet been the previously anticipated velocity of "stress-ridden" sales to fill the voracious appetites of bottom-feeder investors. Some of these investors have been pursuing potential note acquisitions embracing that “loan-to-own mentality” that once permeated our marketplace in previous cycles.
![]()