
Insulated from the Storm--Apartments remain a highly active R.E. sector.
The Dallas-Fort Worth multi-family market consists of nearly 2,600 communities, serving a fundamentally sound and stabilized population base. Surrounding colleges of Southern Methodist University, Texas Christian University, North Texas University, and Baylor Medical College all provide the need for immediate “recession-proof” housing.
As apartments continue to open up for leasing in downtown Dallas, some have said it signals a bright future for the city. But experts say that in the sagging residential market, the glut of urban housing options may push the light at the end of the tunnel a little further down the road.
In the past year, 1,800 units have been opened downtown and in Uptown, said Greg Willett, Vice President of research for M/PF YieldStar; he says that’s too much product to hit the market at one time.
The Dallas-Fort Worth area is considered healthy when vacancy rates hold at about 6 percent, said Willett, who said the area’s current apartment vacancy rate is 9.6 percent, or 54,800 units.
Apartments will remain the investment of choice for the duration of the recession. The availability of long term debt financing through Fannie Mae and Freddie Mac has kept the apartment development cycle thriving. Although the transaction procedures have changed dramatically, investors should anticipate pursuing value-add opportunities. Equity investors are desirous of securing properties which will provide them with a 20%+ Internal Rate of Return.
In the downtown/Uptown area alone, vacancy is at 14.1 percent, or about 2,200 units. “That is certainly the biggest vacancy we’ve seen in the urban core since the mid-1990s,” Willett said. “The economy is hurting demand, and we have delivered a lot of product. The delivery timing is not spaced out enough.” There are another 1,900 apartment units under construction in downtown and Uptown, scheduled for delivery in the next 12 to 18 months. Additionally, there are more than 1,000 units coming to urban areas such as East Dallas and the Design District, right on the periphery of the in-town market.
“Over the long term, it will be fine. We are optimistic about the future,” Willett said. “But the near term will be a beating. It is clearly going to get worse before it gets better.” Rents will remain low, or drop, until apartment inventory levels off.
This has created a “bid to ask” price differential of approximately 25 percent, up from the 10 percent. Few sellers are willing to pay this premium and consequently are sitting out for a while. Many Investors will be seeking qualified and seasoned market professionals who can help them appropriately evaluate the market economic considerations.
![]()
The Flight to Class B
Certain Investors are looking to acquire larger distressed properties which will fall into the attractive price per pound acquisition strategy. Others are focusing upon pursuing Class B properties as there is less economic upside associated with the highly priced Class A multi-family communities. We foresee Class B properties to be a very hot asset, as foreclosed homeowners will be seeking more space and security in their multifamily housing selections.
With a reduction of investor competition, investors should be prepared to battle with the bank. Capital for investments is obtainable, but underwriting and borrowing standards have been tightened significantly. Equity contributions from ownership sponsors have increased substantially from the days of 15% equity downstroke to an expected requisite equity contribution of 30-40 percent. However, opportunities will be abounding for the investor who has the capital to take advantage of the 35% increase in foreclosure filings.
The ability to enter the market with a considerable lower basis will allow new property owners to undercut rents and quickly fill vacancies. Tenants are readily available as the number residential foreclosures reaches near 25,000 from January to May 2009. This first quarter number already surpasses all of 2008 with over 20, 000 foreclosure postings.
With more than 13,000 apartments expected to be delivered in the marketplace, Class A occupancy will slide as it attempts to absorb the new product. This will effectually stop rent growth, leaving tenants with many choices for new luxury apartment property. We expect a significant reduction in new construction as banks set higher underwriting standards for loans or choose to not fund projects. The traditional high leverage afforded to apartment developers has significantly deteriorated.
Lending practices will play a strong role in determining the speed of new acquisition and development, and make long term note assumptions more attractive as it enables the investor time before having to step to the table with cumbersome balloon loan payments.
Depending on the ability of TARP funds and the influence of the Obama administration, developers may find themselves romancing public funds once again. Multi-family residents are becoming increasingly more European in taste and are willing to sacrifice suburbia for the loft apartment and scooter.
Residential areas in major cities such as Dallas where modern transportation systems are available, such as the Dallas Area Rapid Transit (Dart), are becoming increasingly sought after–and a vital component for a long-term play. Mixed-use urban retail, office, and multi-family seems to be a trend that will continue to grow with increased acceptance in the Dallas Metroplex
![]()
City Occupancy Prior 6 Mos. Prior 12 Mos. Average
Dallas [Dallas County] 89.3%
2000's 84% 84% 85%
1990's 92% 93% 93%
1980's 87% 88% 89%
1970's | Older 86% 88% 89%
Fort Worth [Tarrant County] 87.0%
2000's 86% 87% 85%
1990's 92% 94% 93%
1980's 88% 89% 90%
1970's | Older 82% 83% 84%
City Rental Rates Prior 6 Mos. Prior 12 Mos. Average
Dallas [Dallas County] $897
2000's $1,193 $1,198 $1,171
1990's $1,009 $1,028 $1,068
1980's $ 647 $ 671 $ 674
1970's | Older $ 663 $ 673 $ 675
Fort Worth [Tarrant County] $779
2000's $ 945 $ 965 $ 961
1990's $ 911 $ 895 $ 912
1980's $ 626 $ 636 $ 638
1970's | Older $ 597 $ 605 $ 604
City 2010 Prior 6 Mos. Prior 12 Mos. __ __ ___ ___
Dallas [Dallas County] Inventory
Units Added 2.759 5,988 12,066
Units Absorbed (1,440) (633) 1,061
Fort Worth [Tarrant County] Inventory
Units Added 275 3,799 7,039
Units Absorbed (1,533) 1,081 2,270
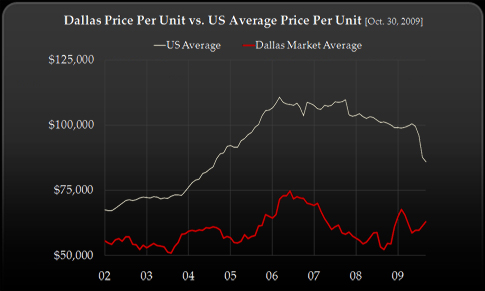
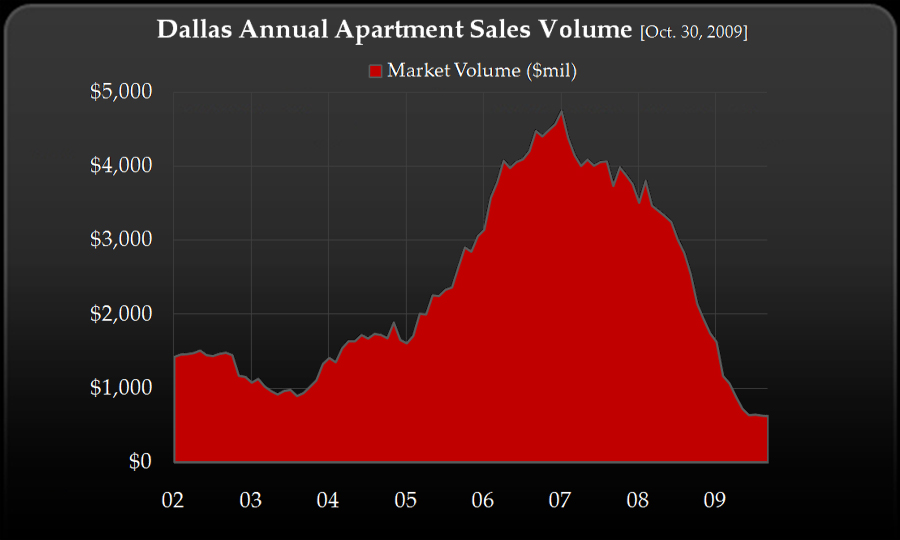
Past 12 Month Sales Volume $735.700,000
Past 12 Month Sales 54 Properties
Past 12 Month Average Price Per Unit $ 53,390
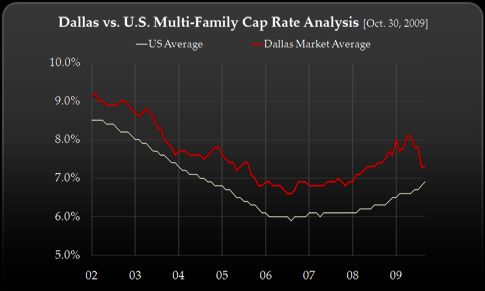
Past 12 Month Average Weighted Cap Rate 7.24%
Past 12 Month Average Mean Cap Rate 6.95%
Inventory Growth: 1.6%
Total Inventory 562,465 Units Under Construction: 9,000 Units _
----------------------------------------------------------------------------------------------------------------------------
DFW Job Growth for 2009: -107,300
----------------------------------------------------------------------------------------------------------------------------
![]()
Cap Rate Explosion = Value Erosion
2008 Cap Rates are not reflective of the current marketplace where cap rates are approaching 10%. Why is this occurring?
Wall Street’s CMBS pipeline filtered massive long-term debt into the commercial real estate market resulting in significant cap rate compression and asset value appreciation. In today’s current market place long term debt is very scarce, and CBMS financing nearly non-existent. Needs for increasing equity and capital liquidity are growing, triggering a cap rate explosion.
Substantive property value erosion is now occurring . Decisive action is becoming increasingly important. Owners must now contemplate the merit of jumping out ahead of a “falling knife” and transacting a property sale or evaluate the “risk-reward” dynamics of holding onto the asset through the next investment cycle. The following graphic depicts this cap rate explosion phenomenon:
Historic Distribution of Cap Rates From 2002 Through 2008
Cap Rate/Year 2008 2007 2006 2005 2004 2003 2002
5% or Less 13.4% 18.28% 15.04% 14.94% 6.03% 1.99% 0.87%
6% or 7% 57.99% 63.39% 61.42% 52.91% 43.18% 27.87% 11.49%
8% or 9% 24.86% 16.47% 20.92% 27.69% 40.94% 52.88% 53.28%
10% or more 3.75% 1.86% 2.62% 4.46% 9.85% 17.27% 34.35%
Data Source: Real Capital Analytics
![]()
The New Rules of Money - Rebalancing the Equity Equation
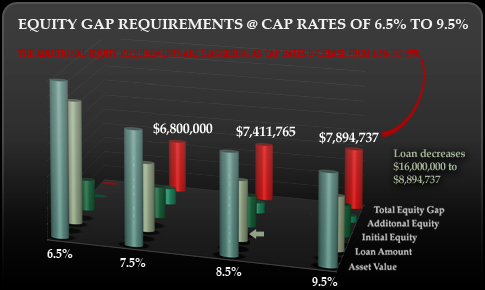
Investors are being forced to reevaluate the asset holding cost of their portfolio assets. With cap rates exploding and property values eroding, the adjusted requisite equity contribution to secure new financing is staggering. The above example contemplates an original $20,000,000 asset and a $4,000,000 equity position.
As the loan underwriters require a 65% loan to value structure, the additional equity requirement is pictured as the cap rates increase at 100 Basis Point Increases from 6.5%-9.5%. The Original Equity of $4,000,000 requires an additional capital requirement of $7,894,737 if cap rates increase to 9.5%.
More importantly the asset value decreases from its orignal $20,000,000 to $11,578,947. All investors who have refinancing requirements in the next five to seven years must evaluate whether or not such additional capital injections are appropriate as they try to optimize their portfolio holdings.
![]()